Decoder-feature confidence probe with an EMA-calibrated training target for dense latent-space reliability estimation.
01 · Overview
Confidence closes the loop.
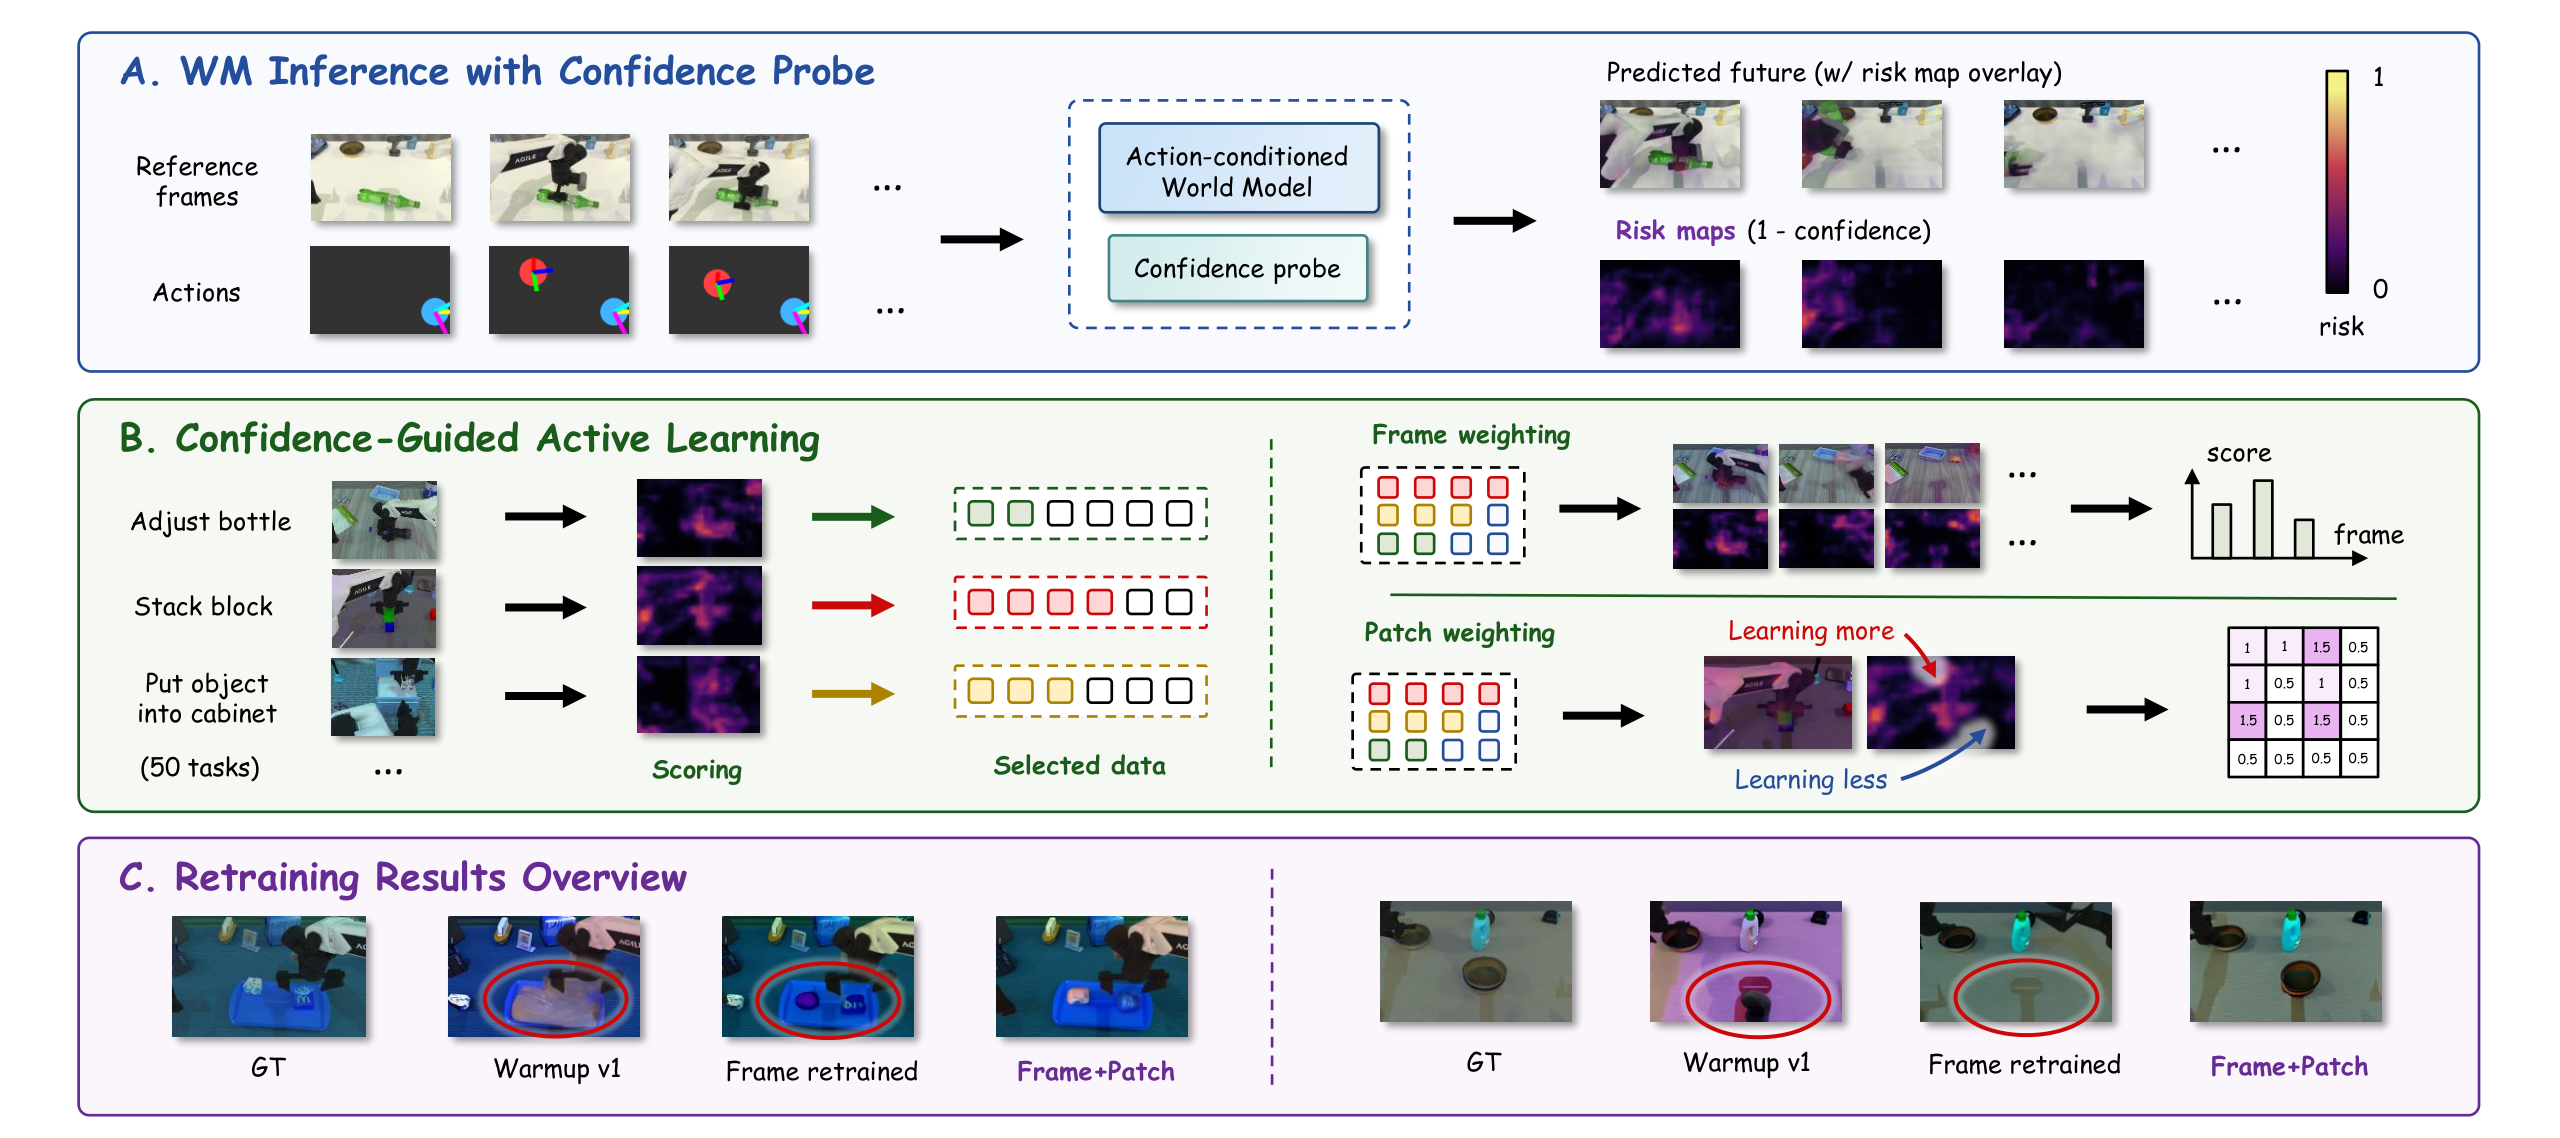
Estimate where the world model is unreliable, spend the post-training budget there, then strengthen supervision on the difficult frames and patches.
Mean risk becomes an acquisition signal for staged, budget-aware active post-training on new task and scene distributions.
Frame-and-patch confidence weighting focuses training on unreliable spatiotemporal regions instead of treating every target equally.
Confidence improves selection and weighted retraining over scalar reward, progress, preference, and judge-based scoring baselines.
02 · Method
Dense confidence, from UNet features to retraining.
One lightweight probe serves two downstream roles: data acquisition and localized data enhancement.
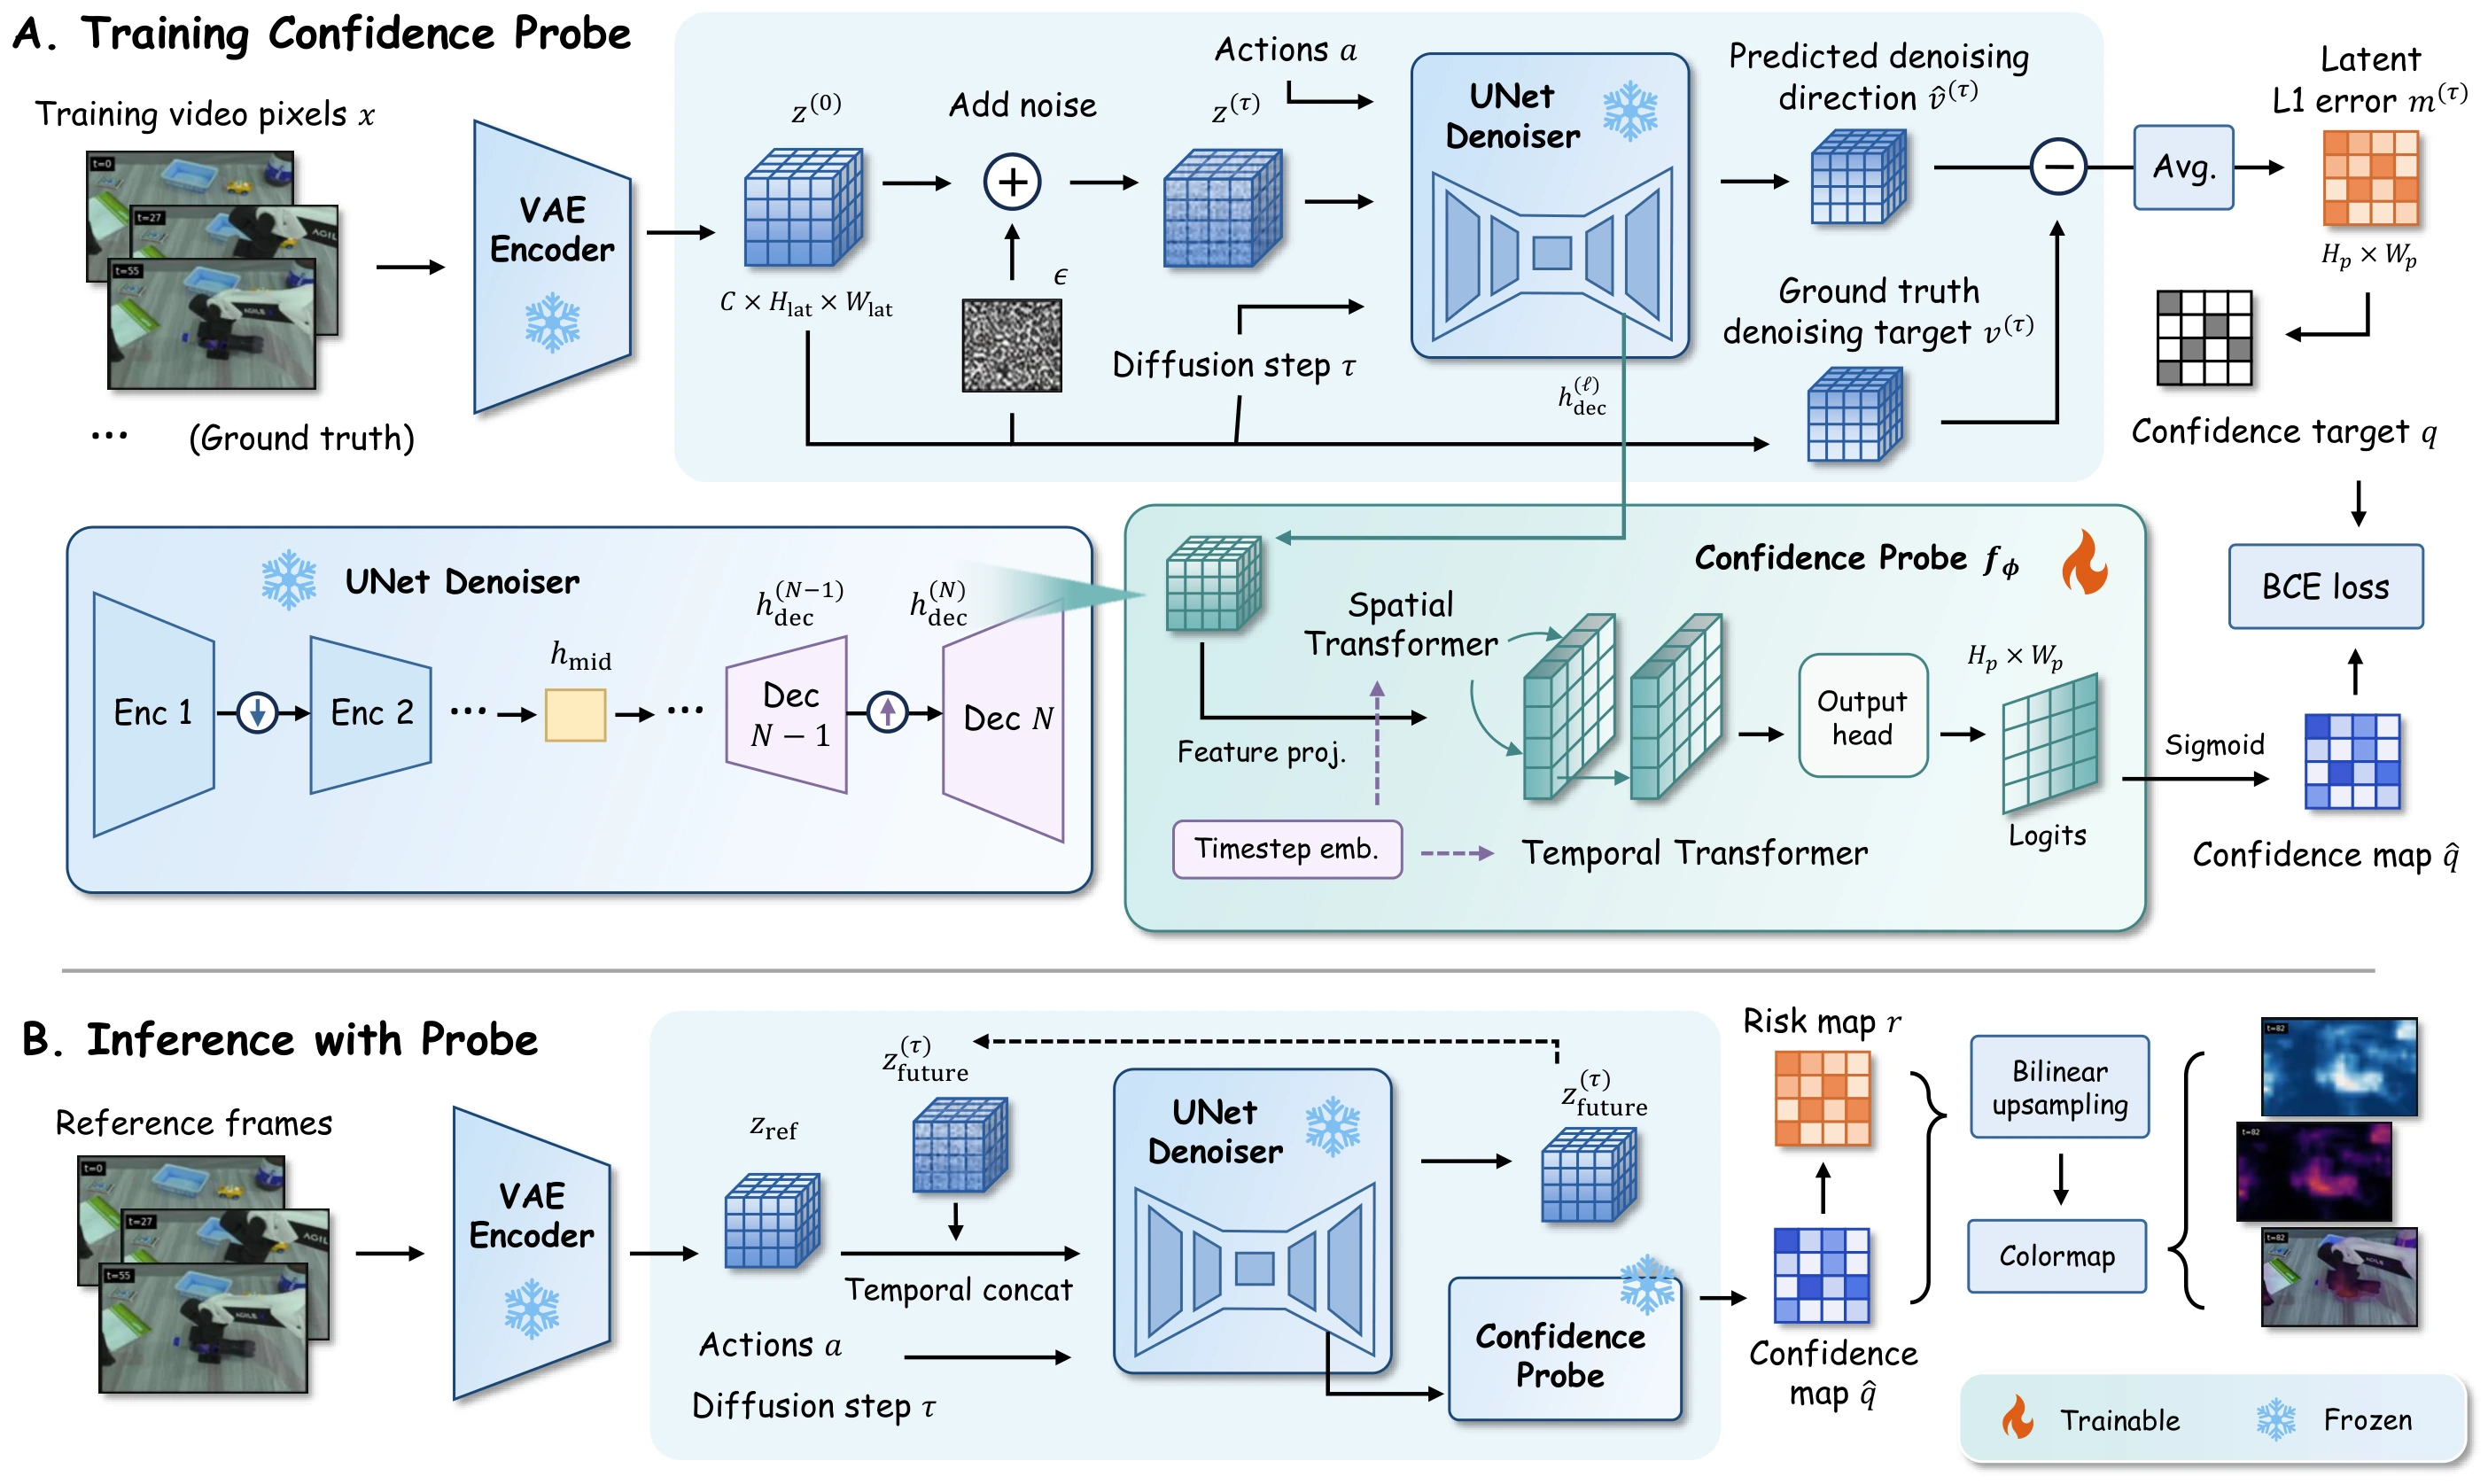
Decoder-feature probe
Tap selectable UNet decoder features: enough spatial locality for patch-wise confidence, while retaining global context.
EMA-calibrated target
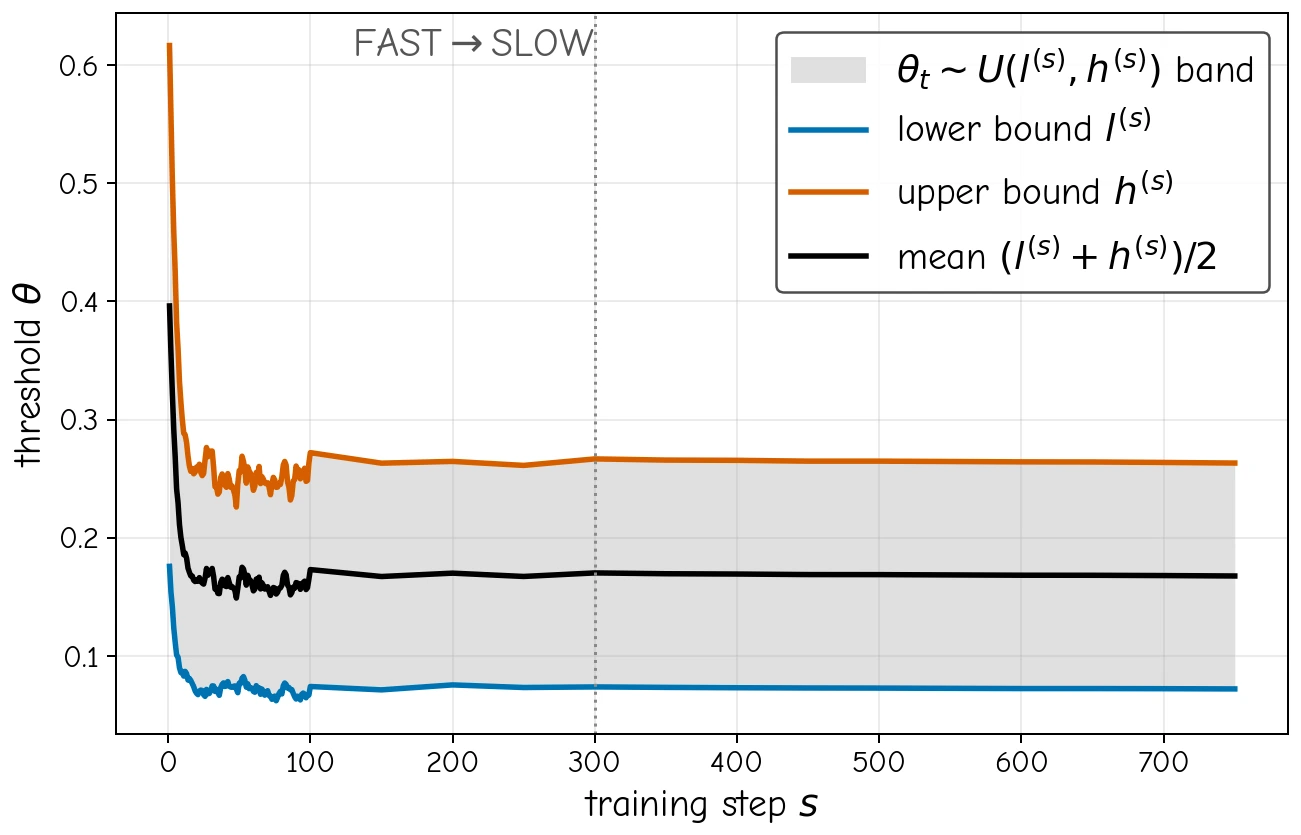
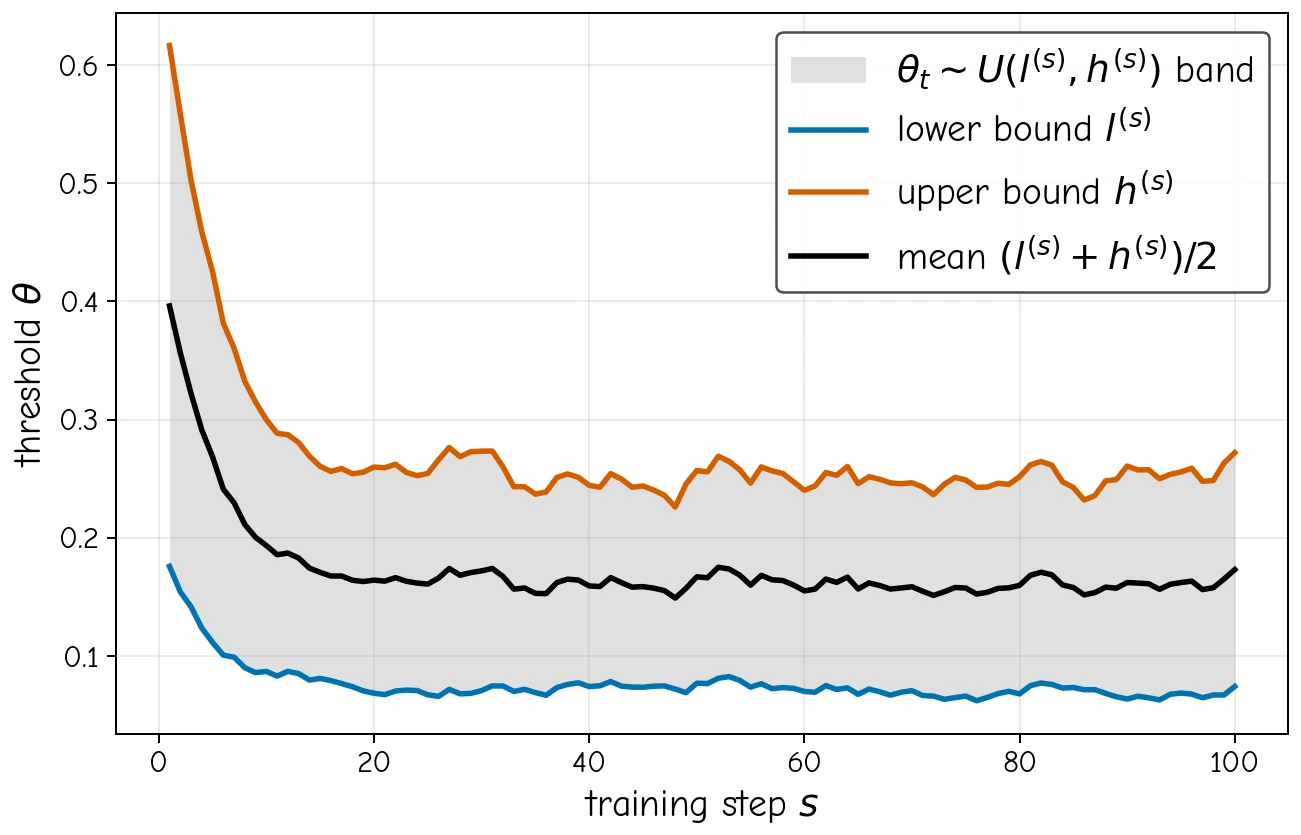
Local latent denoising error is converted into binary confidence supervision using a stable adaptive threshold band.
Mean-risk acquisition
Dense risk maps are aggregated across future frames and spatial patches to prioritize informative tasks and scenes.
Frame + patch weighting
The same dense confidence output becomes a training weight, emphasizing difficult frames and local regions during EVAC-v2 retraining.
03 · Confidence Visualization
Where does the model fail?
50 tasks are organized into 10 groups. Each group shows five tasks × six synchronized video views. Toggle between pixel space (GT / predicted frames) and latent space (latent magnitudes) for the first, second, and last columns.
Group 1 / 10 · Tasks 1–5
04 · Active Learning Results
Post-training numerical results.
Switch between the main bar-chart comparison and three table views. The seed selector updates the same result space.
05 · Qualitative Evolution
Base EVAC → v1 → confidence-guided v2.
Each episode pairs five synchronized videos with a compact metric table. Ten episodes across four pages; the first six match the paper.
Group 1 / 4 · Episodes 1–3 of 10
06 · More Experiments
From confidence signals to design choices and data budgets.
Explore confidence diagnostics, controlled probe ablations, and fixed-update budget comparisons.
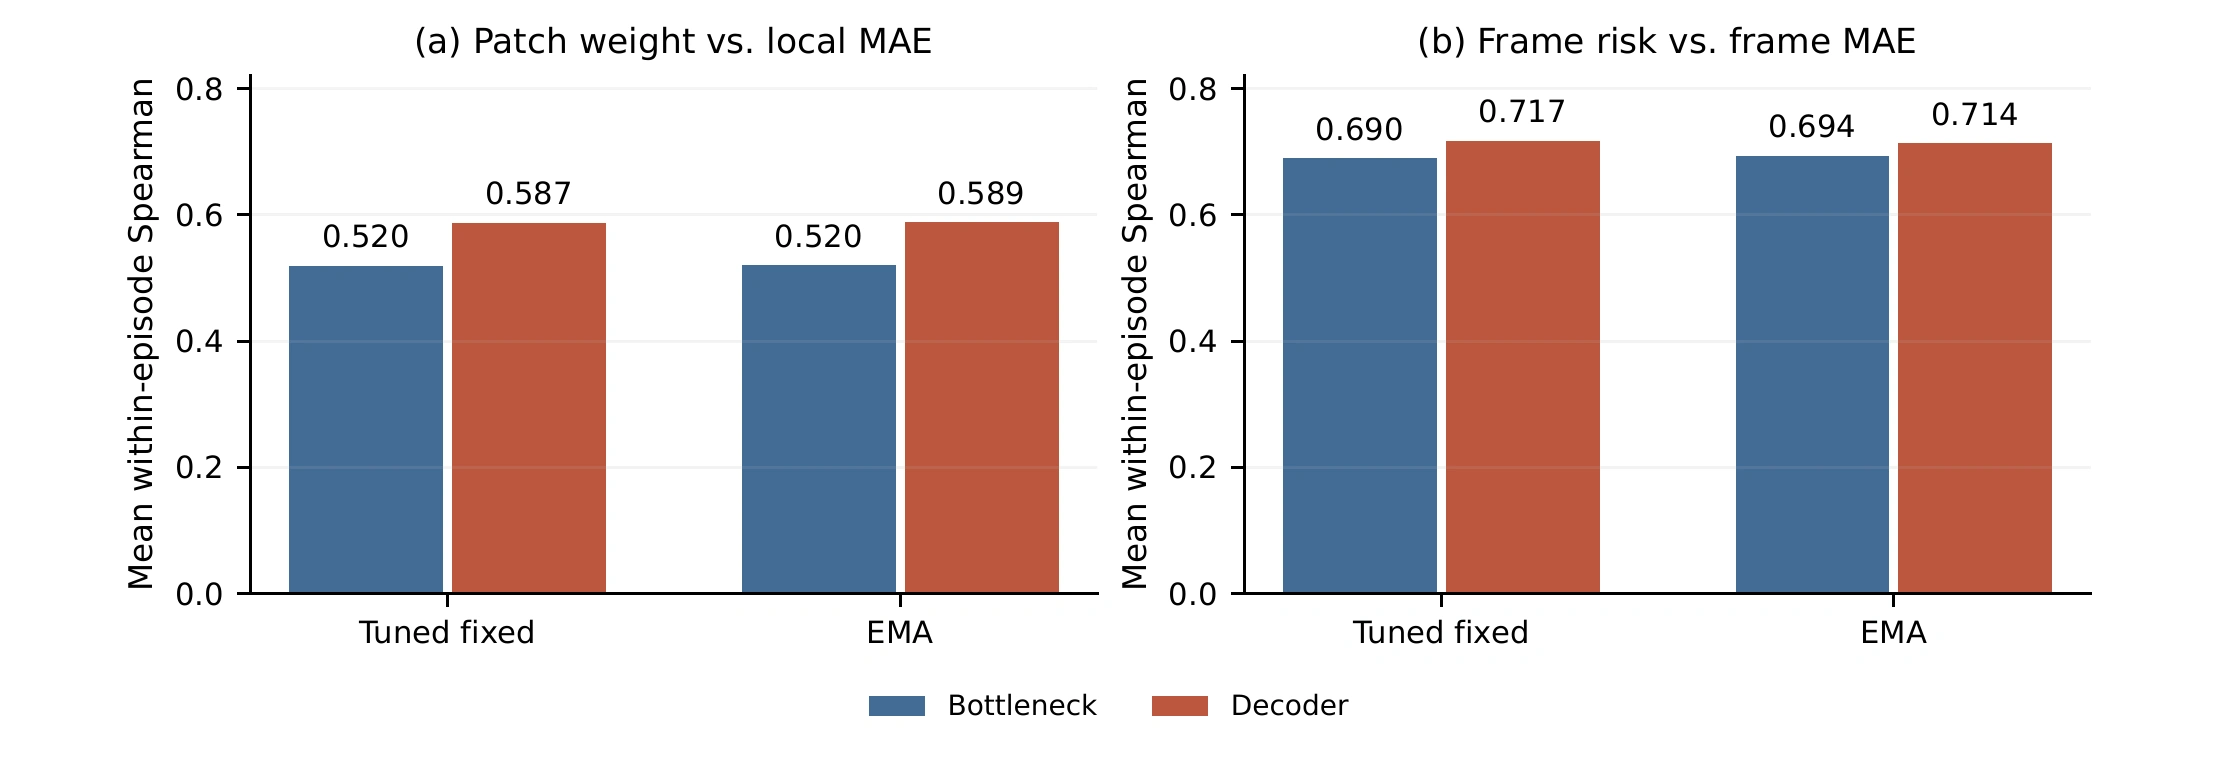
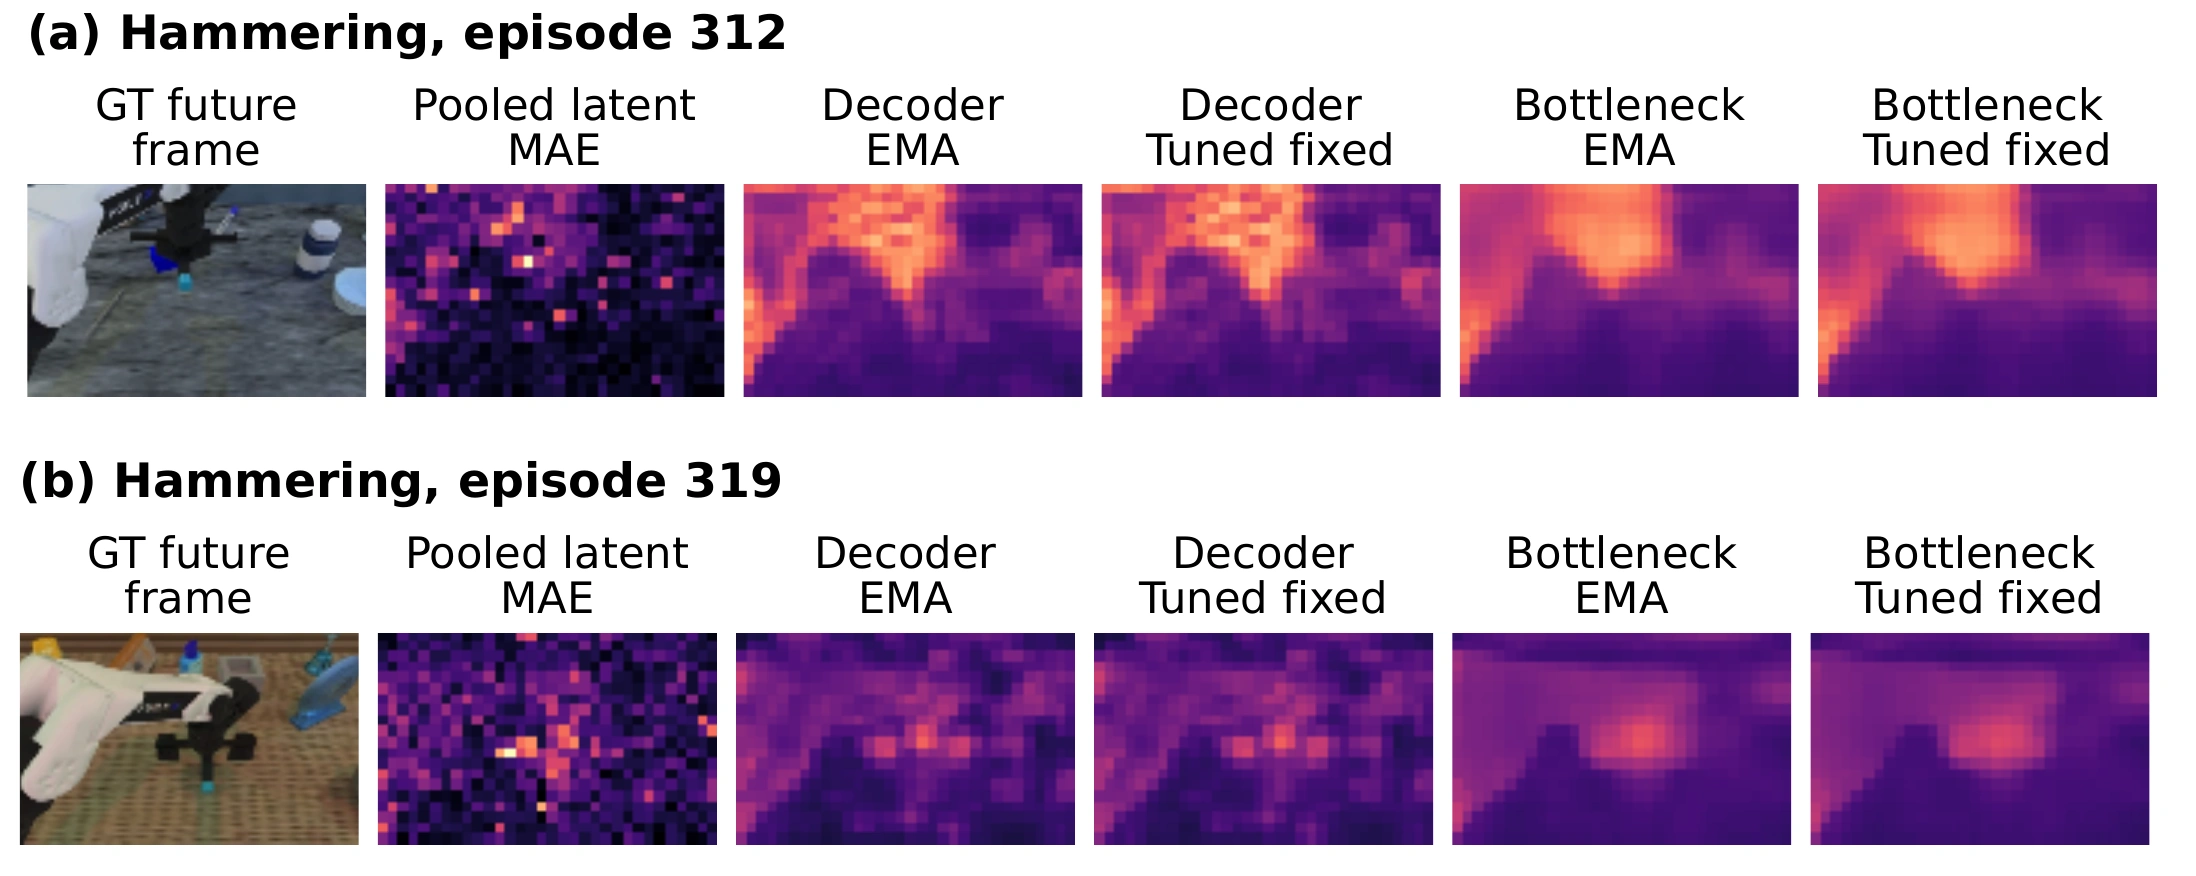
Patch / Frame / Task Spearman 0.540 / 0.590 / 0.595Top-5% patch AUROC 0.761Adjacent-frame top-region IoU 0.740Risk flicker 0.005Peak temporal correlation 0.602
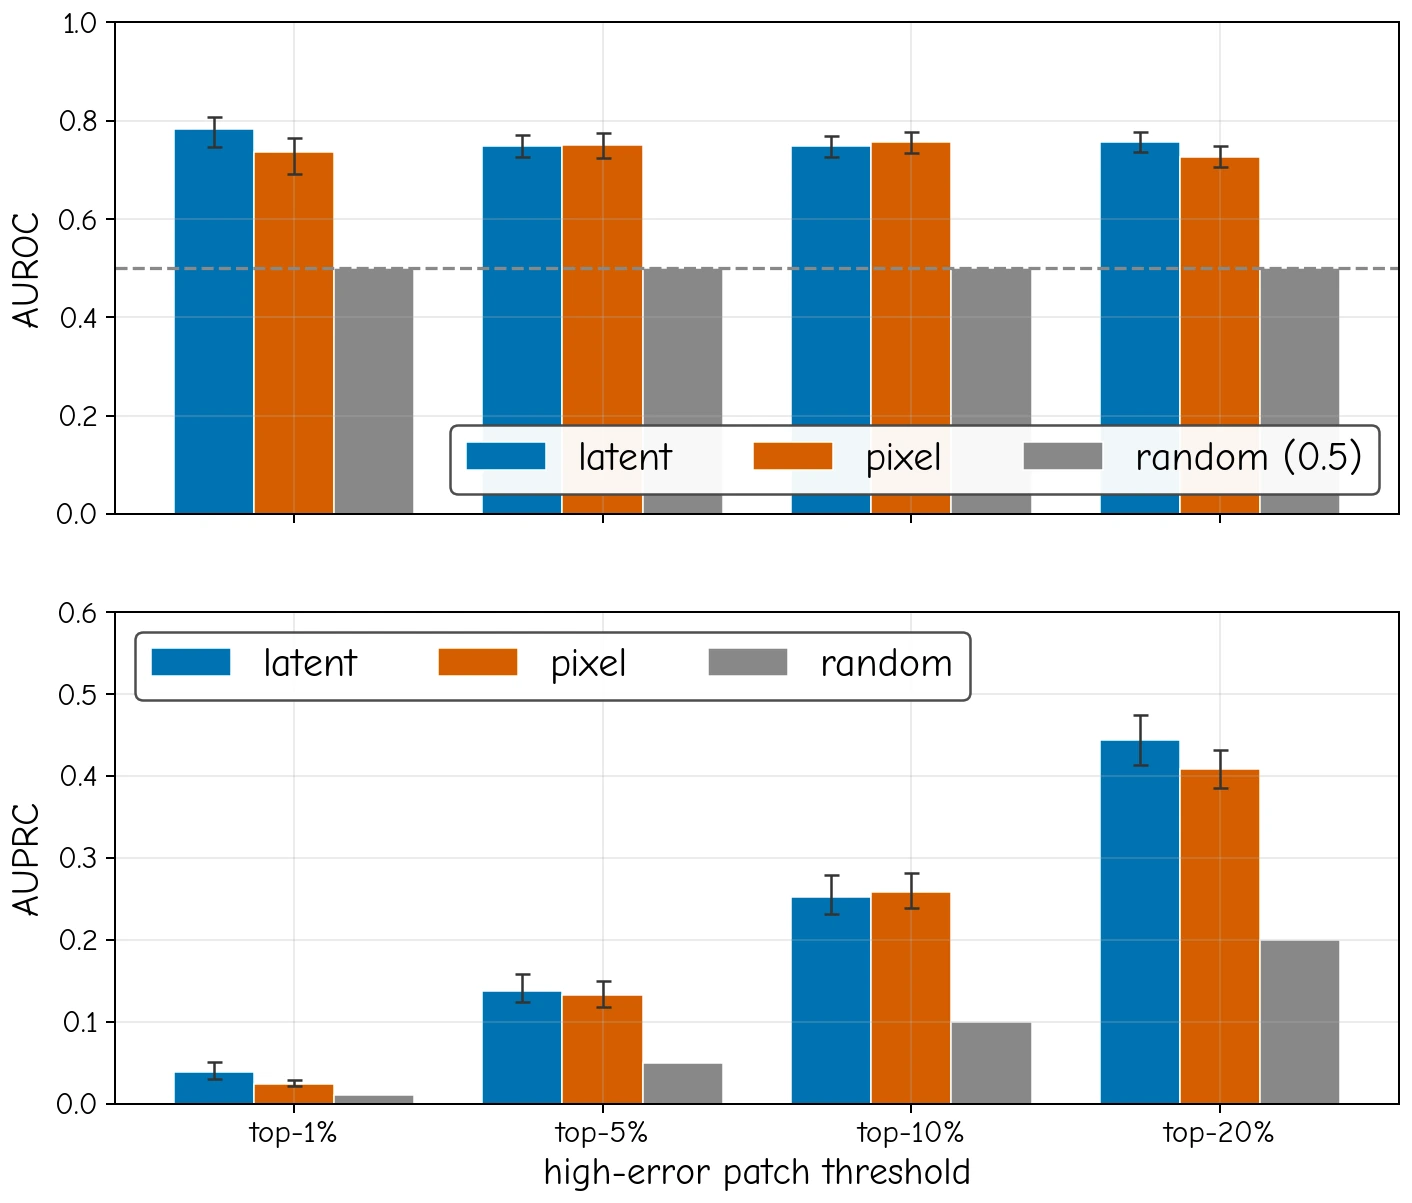
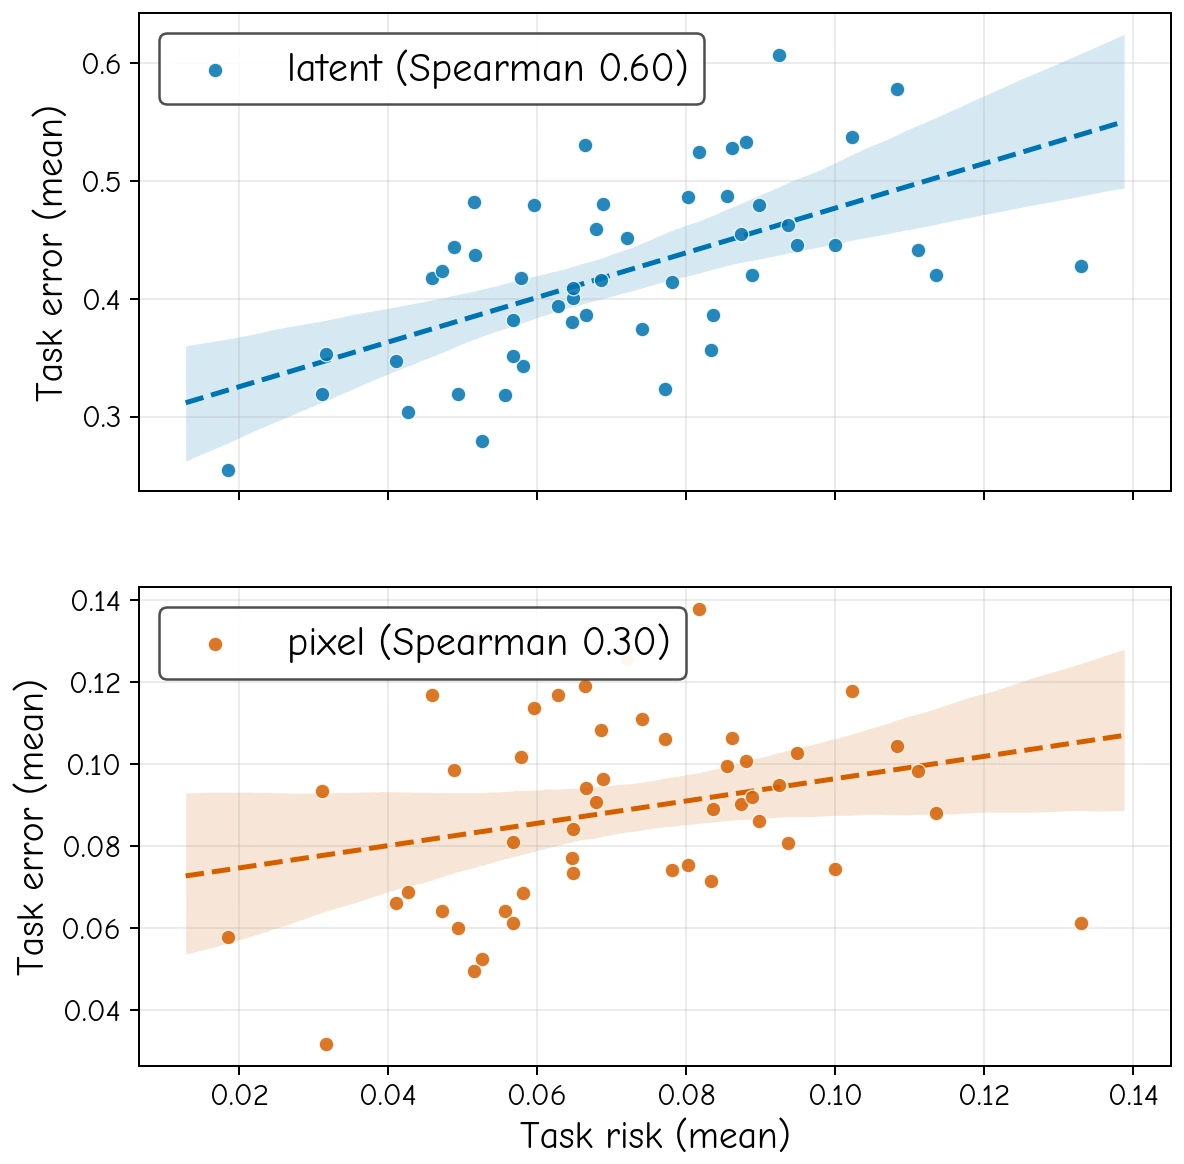
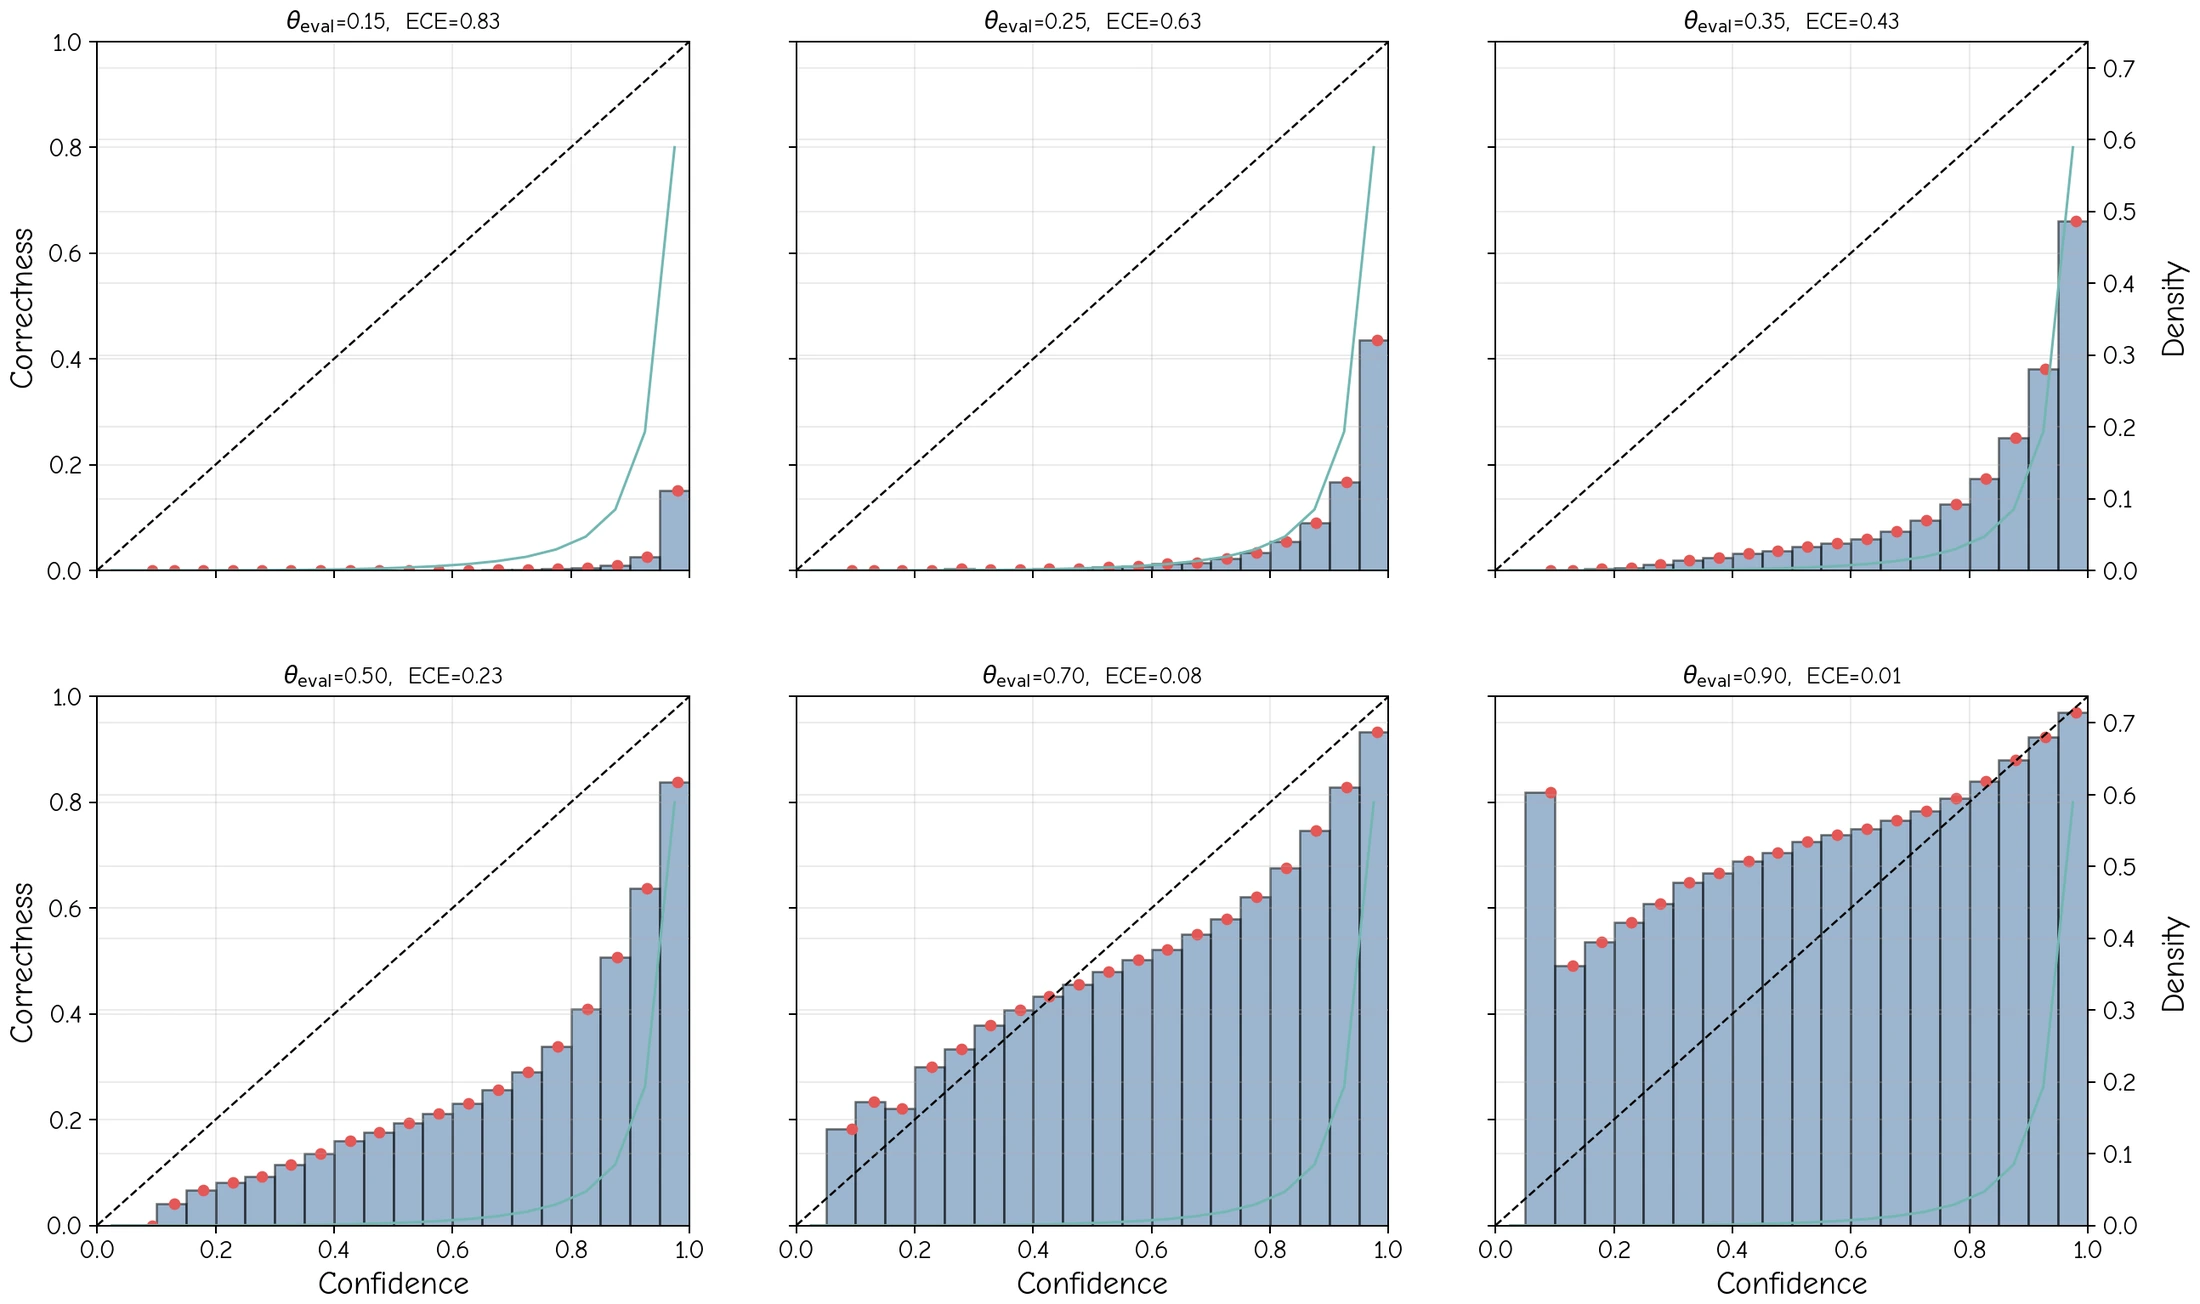
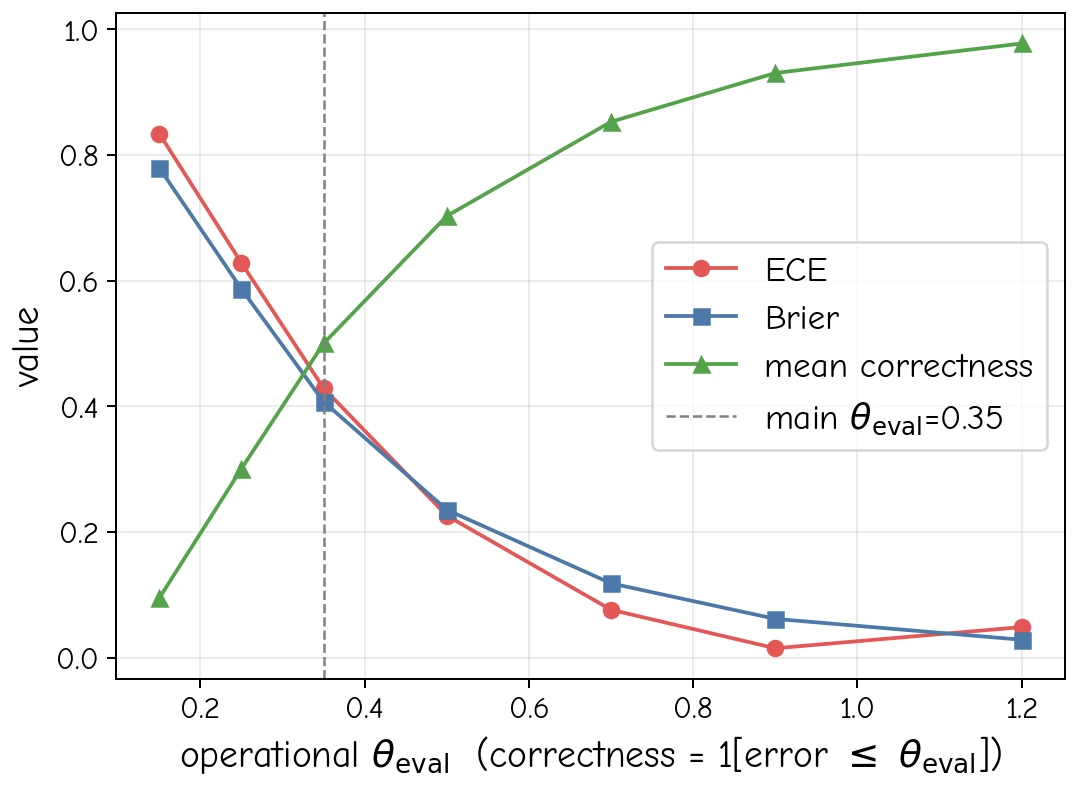
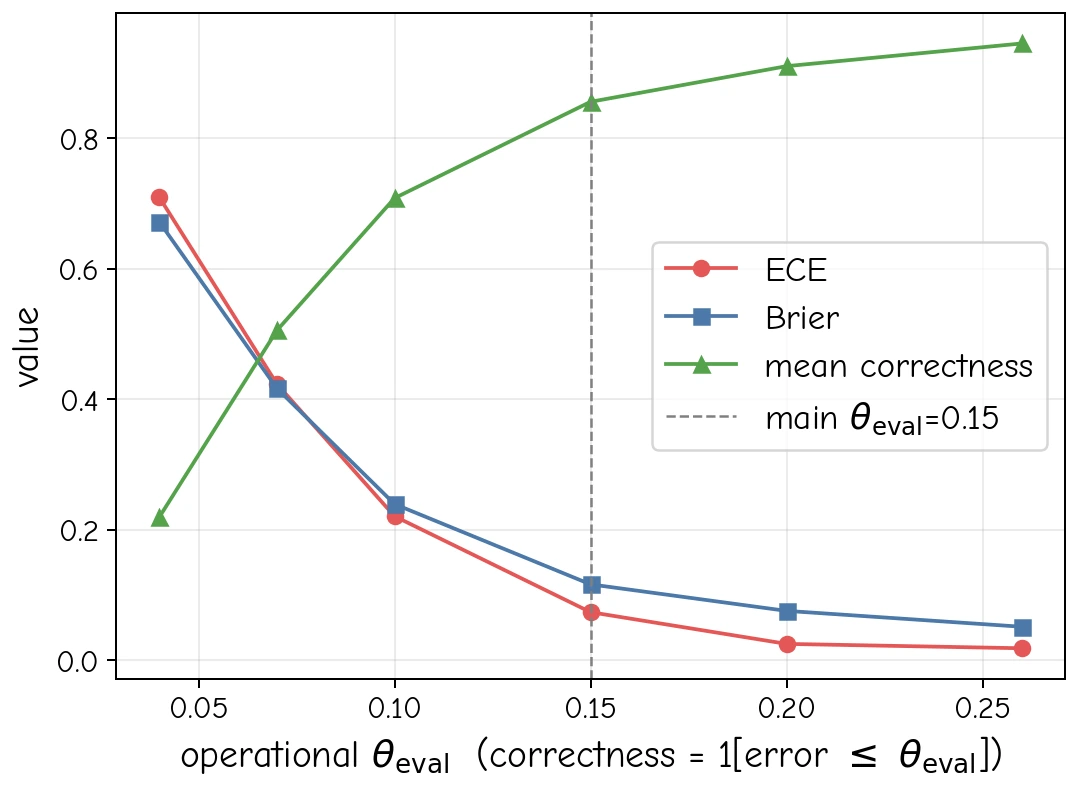
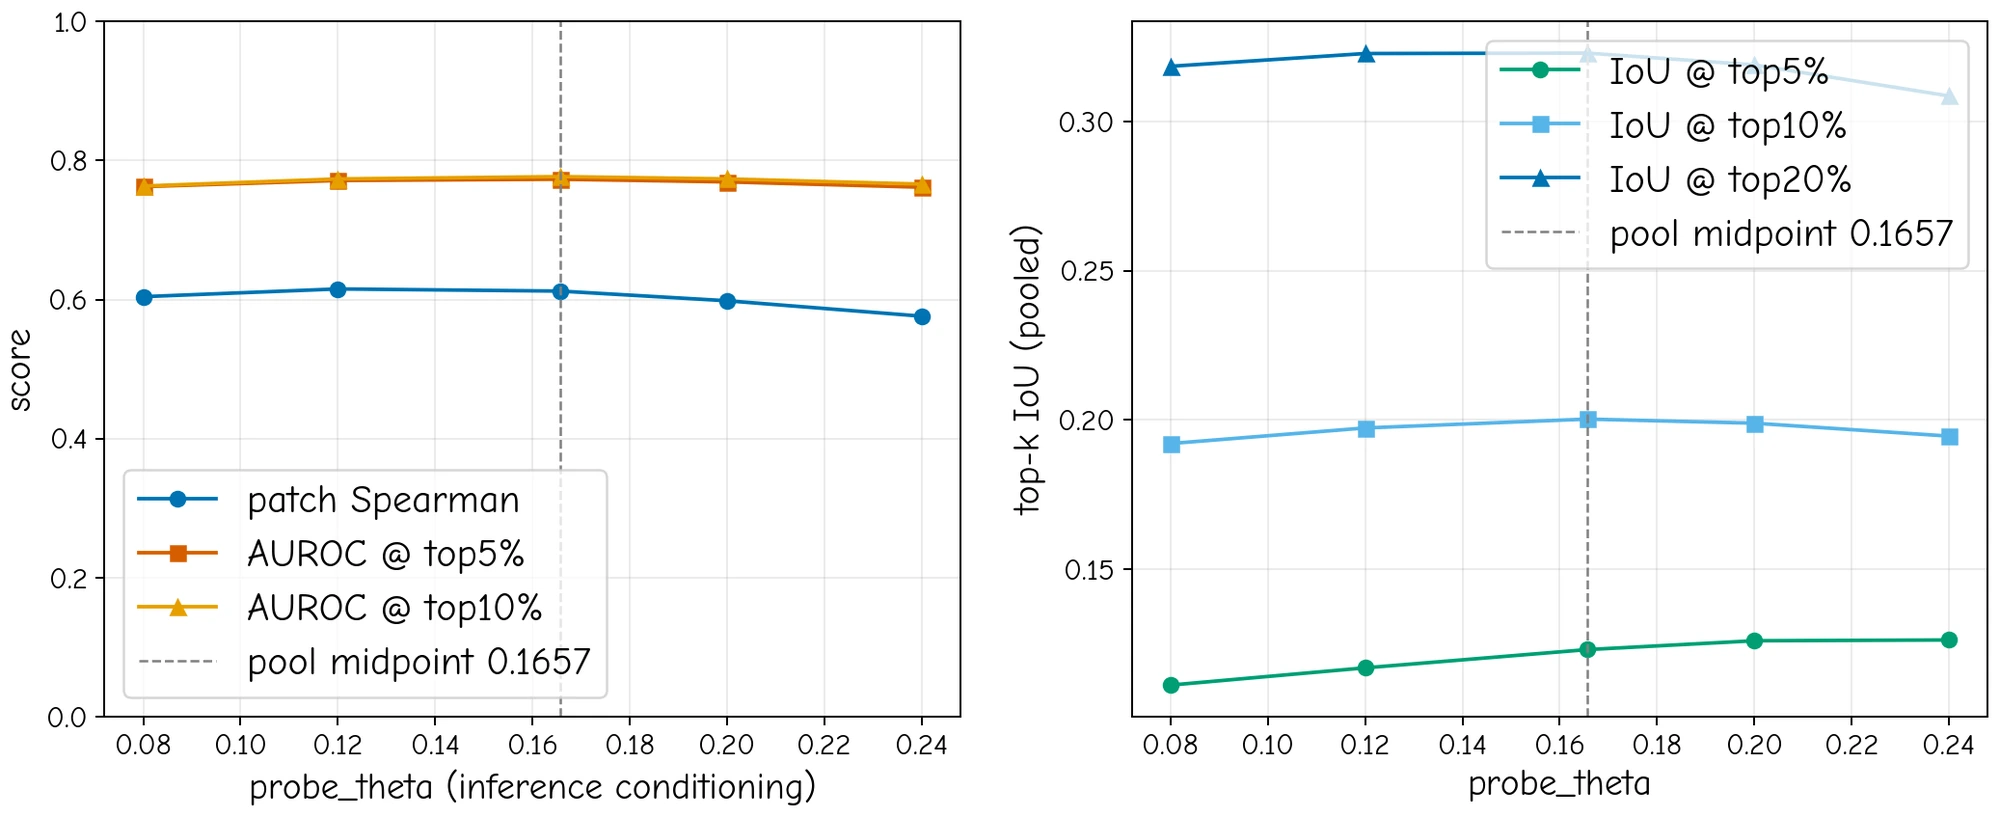
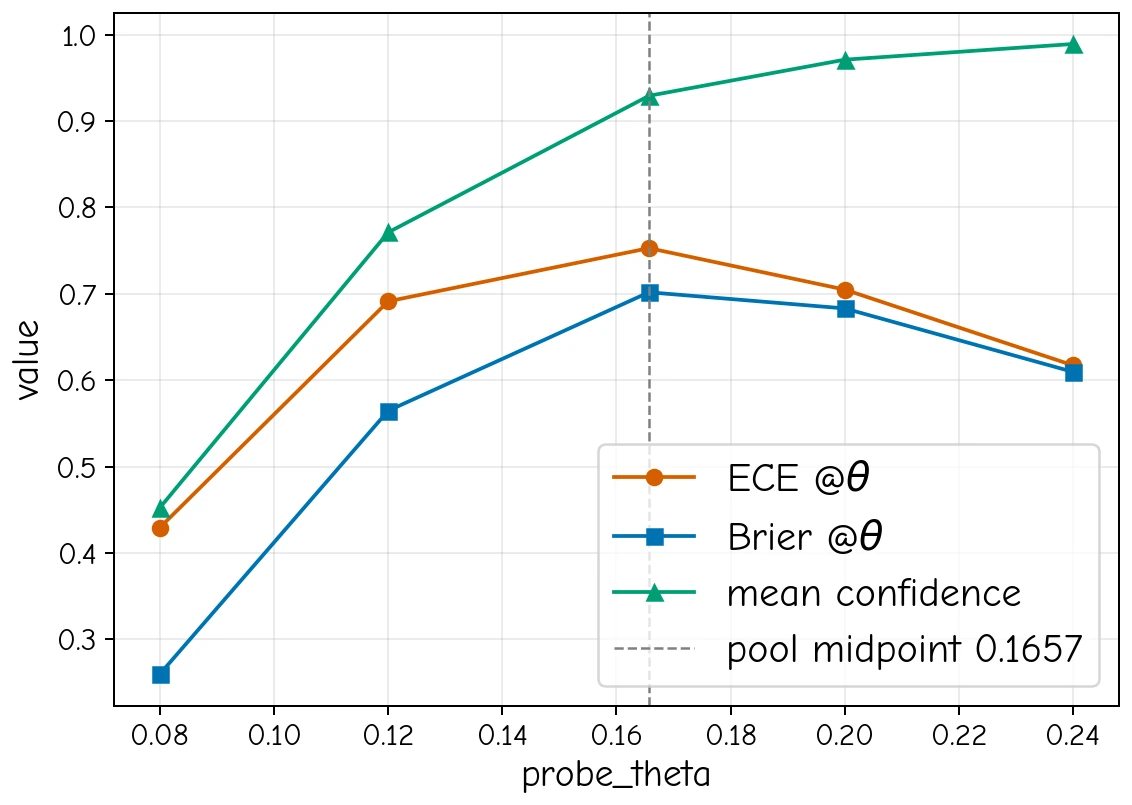
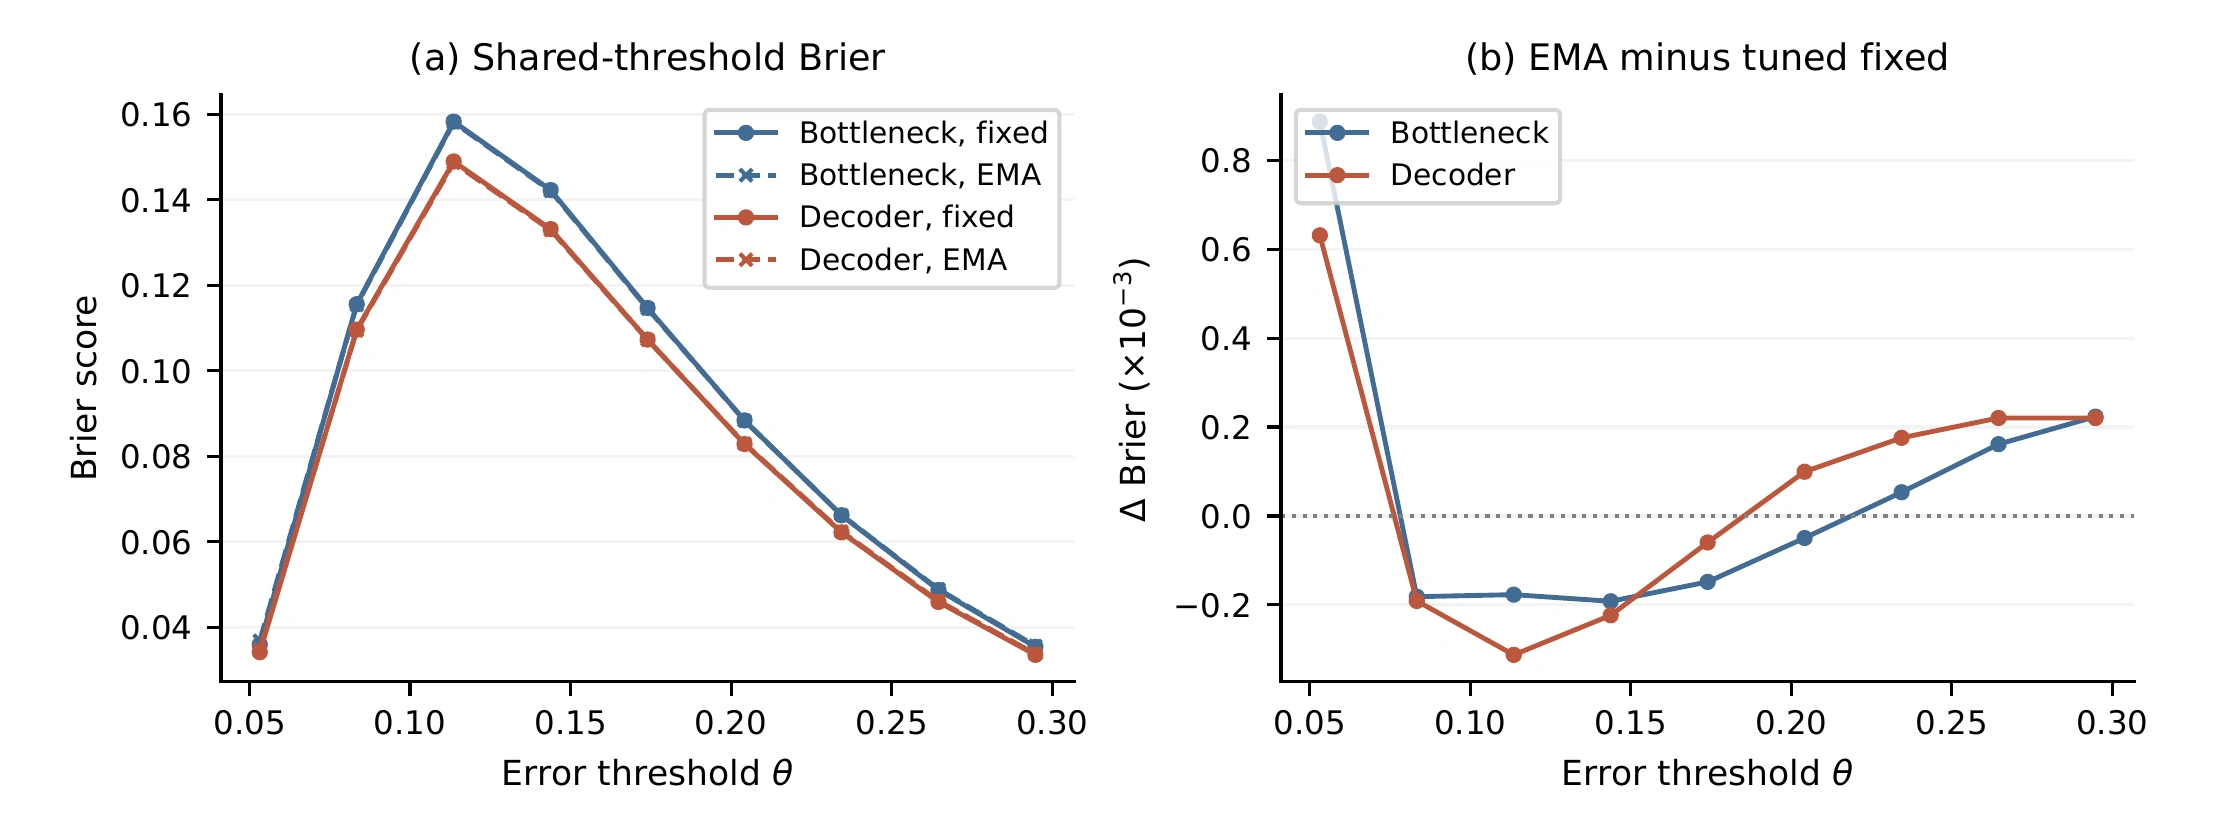
Appendix B.3 · How feature choice and threshold supervision affect confidence quality.
| Feature | Supervision | Brier ↓ | BCE ↓ | ECE ↓ | AUROC ↑ |
|---|---|---|---|---|---|
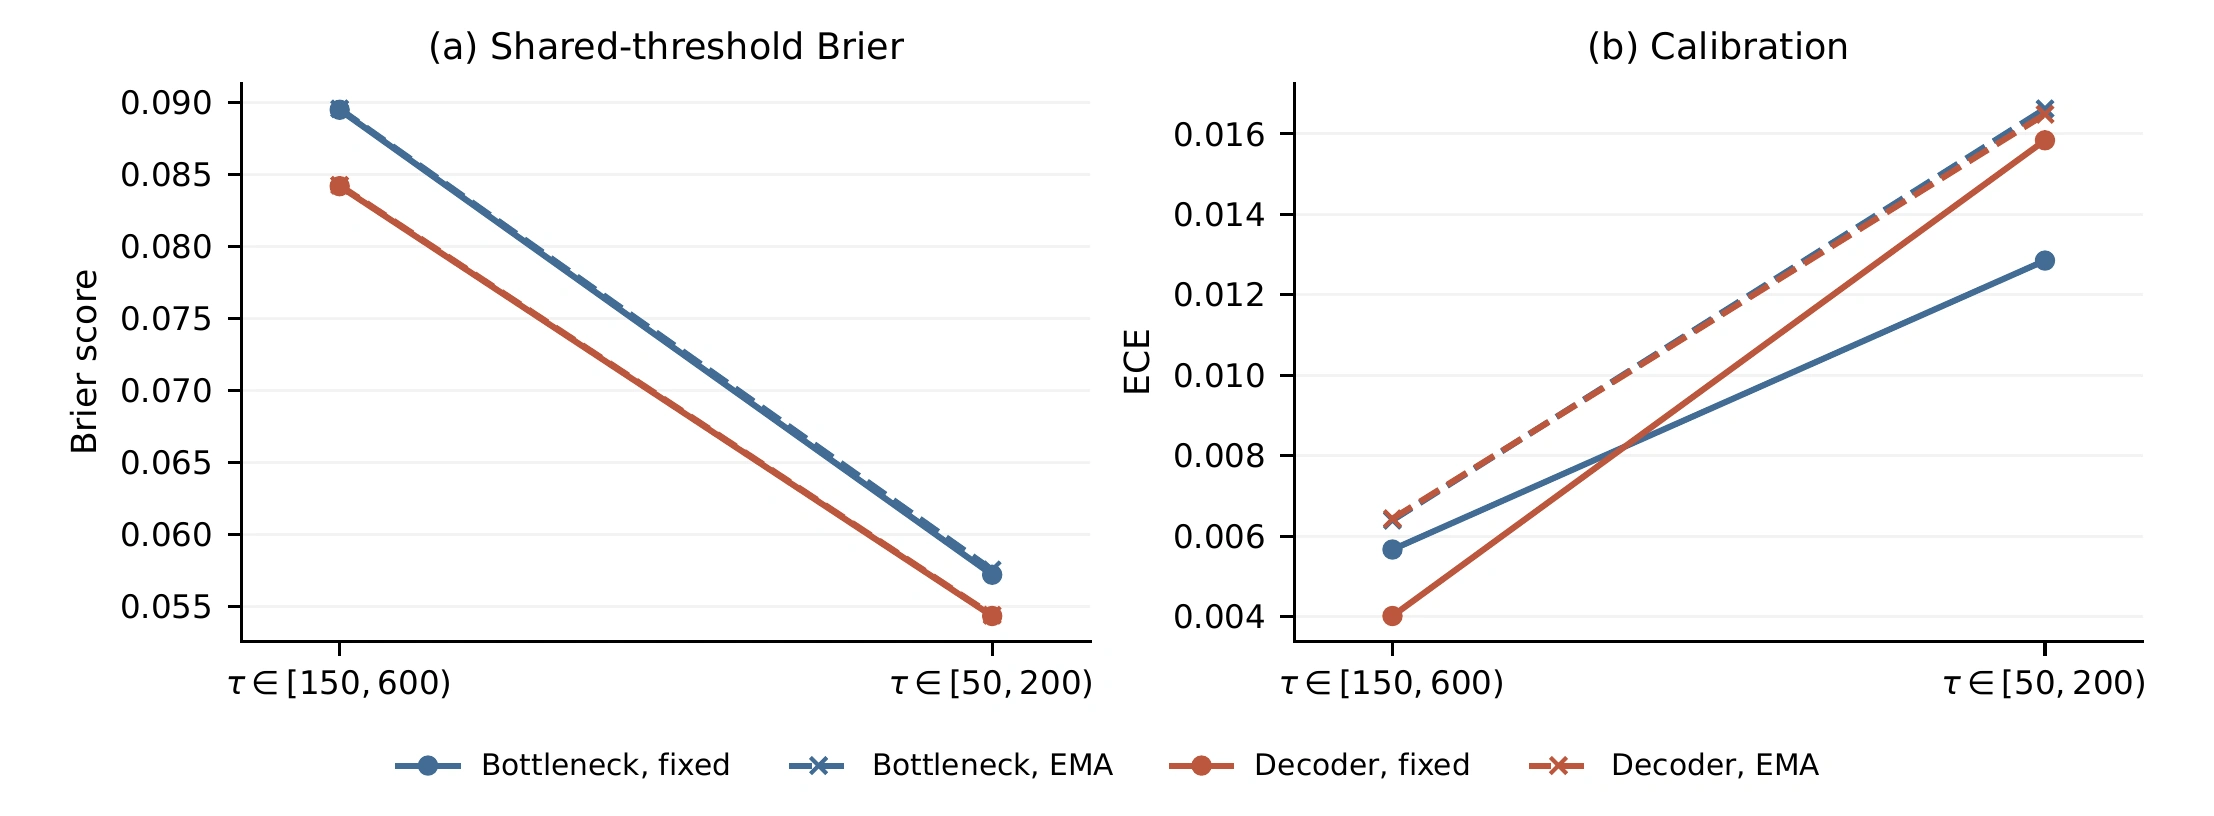
| Bottleneck | Tuned fixed | 0.089487 | 0.288859 | 0.00567 | 0.78379 |
| Bottleneck | EMA | 0.089551 | 0.289220 | 0.00639 | 0.78487 |
| Decoder | Tuned fixed | 0.084181 | 0.271915 | 0.00402 | 0.82237 |
| Decoder | EMA | 0.084243 | 0.272314 | 0.00643 | 0.82184 |
| Feature | Supervision | Cal. Brier ↓ | Test Brier ↓ | Test ECE ↓ | Test AUROC ↑ | Low-noise Brier ↓ |
|---|---|---|---|---|---|---|
| Bottleneck | Fixed [0.20, 0.70] | 0.154102 | 0.153483 | 0.12854 | 0.77596 | 0.090326 |
| Bottleneck | Fixed [Q.10, Q.90] | 0.092173 | 0.089468 | 0.00670 | 0.78338 | 0.057385 |
| Bottleneck | Fixed [Q.05, Q.95] † | 0.092149 | 0.089487 | 0.00567 | 0.78379 | 0.057210 |
| Bottleneck | Fixed [Q.20, Q.80] | 0.092776 | 0.090206 | 0.01182 | 0.78185 | 0.058627 |
| Bottleneck | EMA | 0.092239 | 0.089551 | 0.00639 | 0.78487 | 0.057544 |
| Bottleneck | EMA-Qinit | 0.092101 | 0.089477 | 0.00694 | 0.78517 | 0.057503 |
| Decoder | Fixed [0.20, 0.70] | 0.133136 | 0.133257 | 0.10630 | 0.81088 | 0.085256 |
| Decoder | Fixed [Q.10, Q.90] | 0.086885 | 0.084235 | 0.00617 | 0.82313 | 0.054462 |
| Decoder | Fixed [Q.05, Q.95] † | 0.086872 | 0.084181 | 0.00402 | 0.82237 | 0.054344 |
| Decoder | Fixed [Q.20, Q.80] | 0.087667 | 0.085248 | 0.01142 | 0.82040 | 0.056637 |
| Decoder | EMA | 0.086867 | 0.084243 | 0.00643 | 0.82184 | 0.054400 |
| Decoder | EMA-Qinit | 0.086840 | 0.084266 | 0.00548 | 0.82235 | 0.054522 |
Q denotes a training-error quantile. EMA-Qinit starts at [Q.10, Q.90]; bold values mark the best result within each feature group.
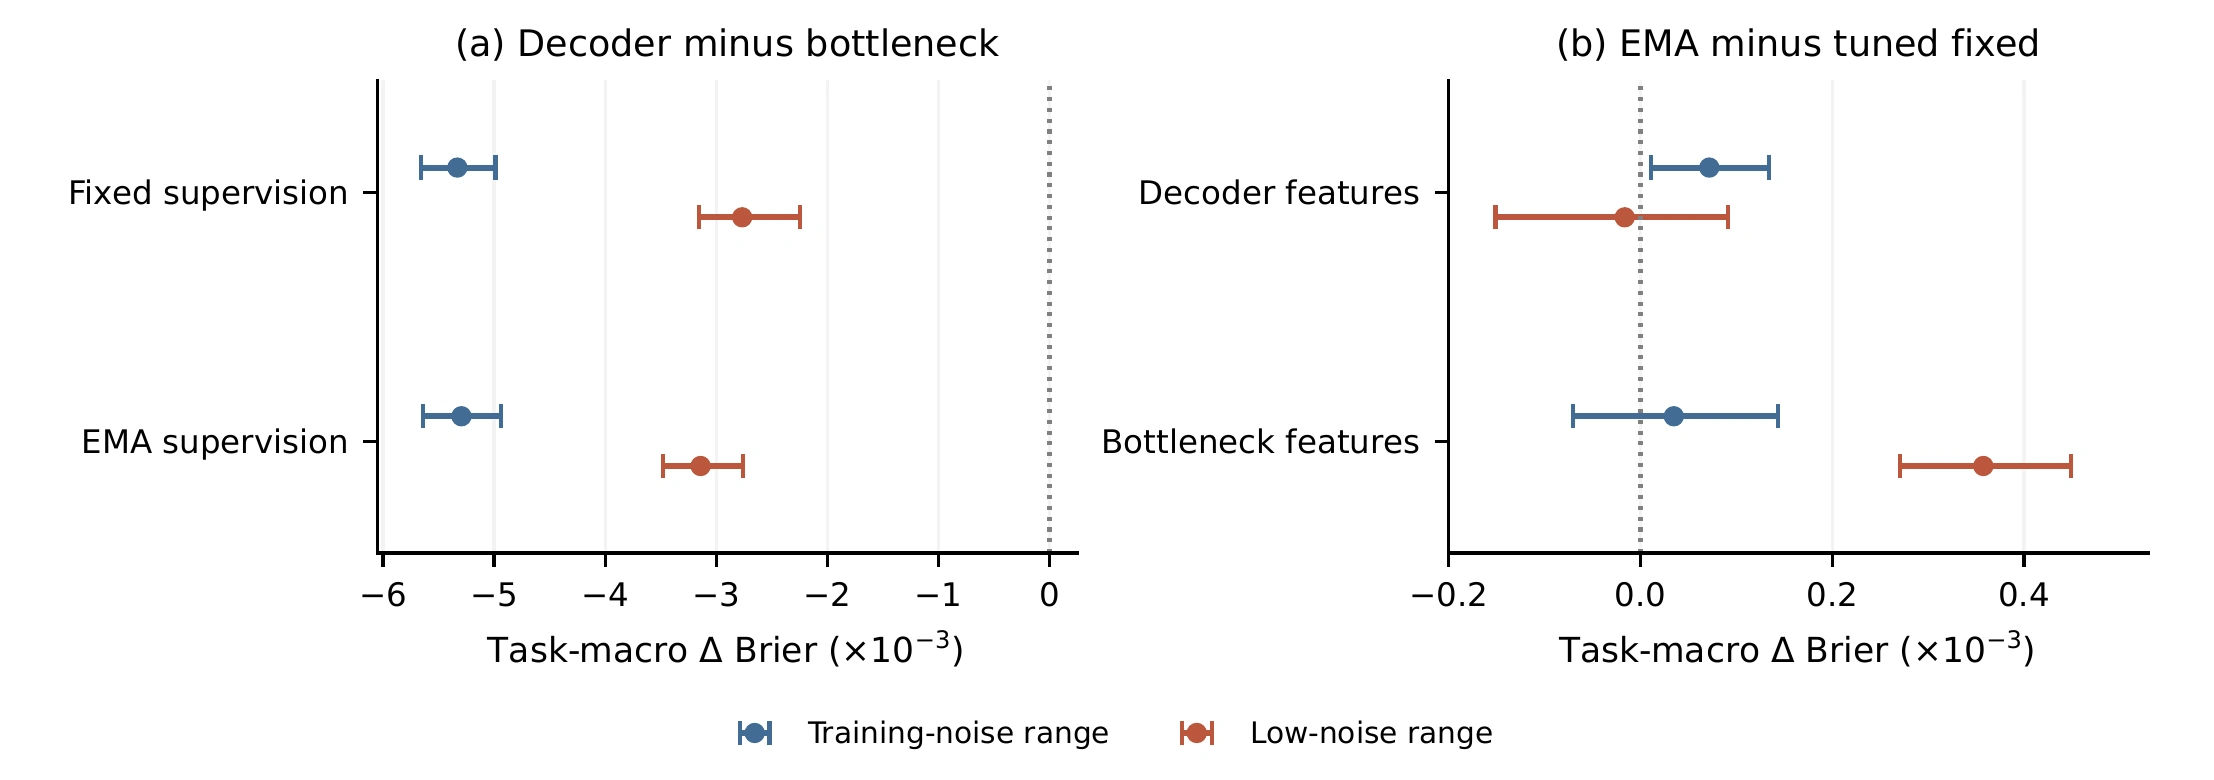
| Contrast | Training noise · Δ | Training noise · 95% CI | Low noise · Δ | Low noise · 95% CI |
|---|---|---|---|---|
| Decoder − bottleneck (fixed) | −5.331 | [−5.657, −4.987] | −2.767 | [−3.156, −2.243] |
| Decoder − bottleneck (EMA) | −5.294 | [−5.637, −4.934] | −3.141 | [−3.475, −2.762] |
| EMA − fixed (decoder) | +0.072 | [+0.011, +0.134] | −0.016 | [−0.151, +0.091] |
| EMA − fixed (bottleneck) | +0.035 | [−0.071, +0.143] | +0.358 | [+0.270, +0.449] |
| Feature × supervision | +0.037 | [−0.090, +0.170] | −0.374 | [−0.562, −0.229] |
Appendix B.5 · Confidence versus random selection across data budgets, with the same training steps.
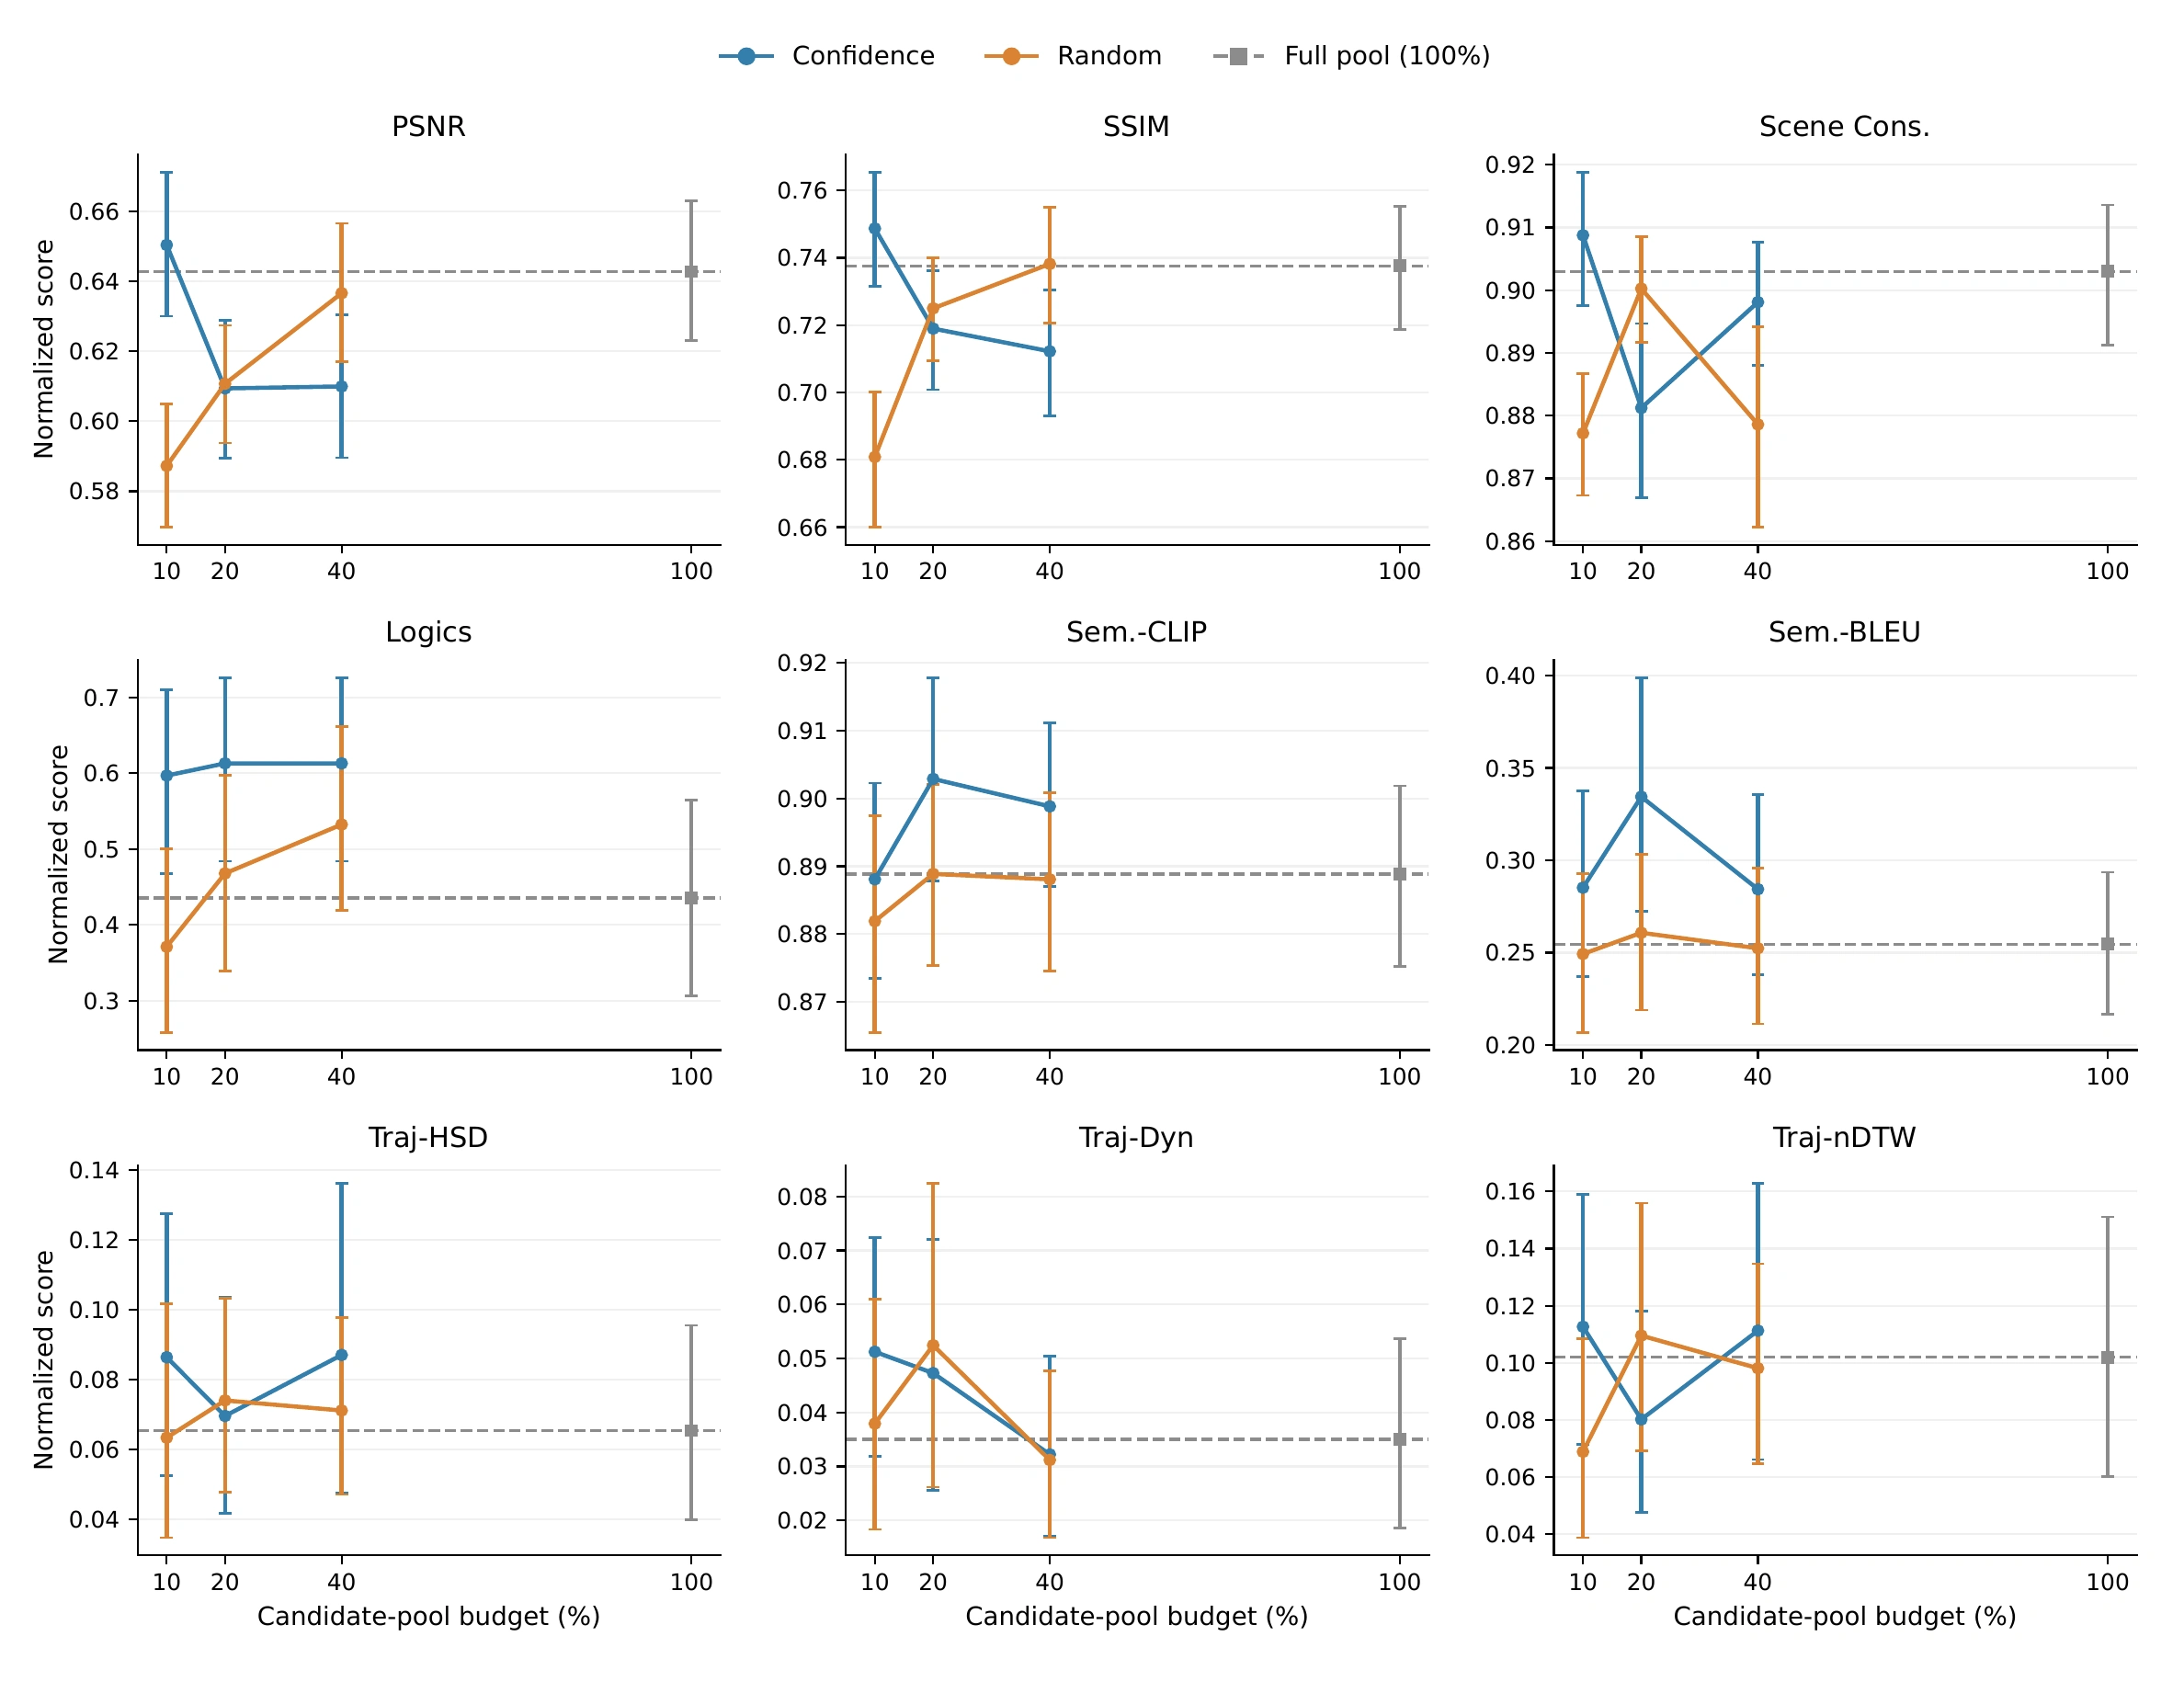
| Budget | Selection | Episodes | Reconstruction ↑ | Scene ↑ | Semantics ↑ | Motion ↑ | Train GPU-h |
|---|---|---|---|---|---|---|---|
| 10% | Random | 1,824 | 0.6341 | 0.8772 | 0.5007 | 0.1701 | 4.47 |
| 10% | Confidence | 1,824 | 0.6995 | 0.9088 | 0.5900 | 0.2502 | 4.45 |
| 20% | Random | 3,649 | 0.6679 | 0.9003 | 0.5391 | 0.2360 | 4.45 |
| 20% | Confidence | 3,649 | 0.6642 | 0.8812 | 0.6167 | 0.1970 | 4.44 |
| 40% | Random | 7,298 | 0.6874 | 0.8786 | 0.5576 | 0.2004 | 4.44 |
| 40% | Confidence | 7,298 | 0.6611 | 0.8981 | 0.5987 | 0.2305 | 4.47 |
| 100% | Full pool | 18,244 | 0.6902 | 0.9030 | 0.5263 | 0.2023 | 4.46 |
Bold marks the higher score within each confidence/random pair. Reconstruction, Scene and Motion use 62 episodes; CLIP/BLEU use 56, and Semantics averages the available component means.
| Budget | Δ Reconstruction ↑ | Δ Scene ↑ | Δ Semantics ↑ | Δ Motion ↑ |
|---|---|---|---|---|
| 10% | +0.0655 [0.0534, 0.0772] | +0.0316 [0.0229, 0.0396] | +0.0914 [0.0247, 0.1563] | +0.0801 [0.0293, 0.1391] |
| 20% | −0.0037 [−0.0186, 0.0112] | −0.0190 [−0.0296, −0.0089] | +0.0768 [0.0119, 0.1425] | −0.0389 [−0.1023, 0.0185] |
| 40% | −0.0263 [−0.0411, −0.0120] | +0.0195 [0.0031, 0.0362] | +0.0440 [−0.0164, 0.1021] | +0.0301 [−0.0570, 0.1390] |
10,000 episode-bootstrap resamples. Reconstruction, Scene and Motion use 62 common episodes; Semantics uses the 56-episode intersection, so paired differences can differ slightly from subtracting Table 13.
07 · Models & Data
Everything needed to reproduce the loop.
Model weights, confidence probes, trajectory detector, prescreen outputs, v2 scoring artifacts, and YOLO annotations.
Models
Planned public checkpoints.
EVAC · Warmup v1RoboTwin2.0 domain-adapted warmup
🤗 DownloadEVAC-v2 · Weighting NoneMean-risk selection-only checkpoint
🤗 DownloadEVAC-v2 · FrameConfidence-guided frame weighting
🤗 DownloadEVAC-v2 · Frame + PatchDense confidence-guided enhancement
🤗 DownloadConfidence Probe · RoboTwin2.0Main probe used in the paper
🤗 DownloadConfidence Probe · AgiBot WorldAdditional confidence checkpoint
🤗 DownloadYOLO · RoboTwin2.0Trajectory-metric detector for EWMBench-style evaluation
🤗 DownloadData & Evaluation Artifacts
Precomputed outputs that avoid expensive repeated inference.
50-task prescreen packageEVAC-v1 inference, confidence scores, risk maps, and JSON metadata
🤗 DownloadEVAC-v2 training · inference + JSONPrecomputed v1 inference outputs + episode metadata
🤗 DownloadEVAC-v2 training · dense confidence + JSONDense confidence/risk outputs and metadata for confidence-guided retraining
🤗 DownloadBaseline selection · v1 inference resultsEVAC-v1 inference outputs for tasks/scenes selected by acquisition baselines
🤗 DownloadBaseline weighting · v2 frame-scoring dataFrame-level scoring artifacts used by the additional-weighting baseline experiments
🤗 DownloadYOLO RoboTwin2.0 annotationsRobot-arm trajectory labels estimated from RoboTwin2.0 action conditions
🤗 DownloadEvaluation tables & bootstrap JSONMean / seed-wise metrics and pooled paired-bootstrap statistics
🤗 Download08 · Citation
Cite ConfAL-WM.
The copy button writes the BibTeX block directly to the clipboard.
@article{confalwm2026,
  title   = {ConfAL-WM: Confidence-Guided Active Learning for Action-Conditioned World Models},
  author  = {Anonymous Authors},
  journal = {arXiv preprint},
  year    = {2026},
  url     = {https://ConfAL-WM.github.io}
}

% TODO: replace author / arXiv identifier / venue when public.